Download
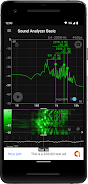
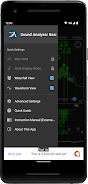
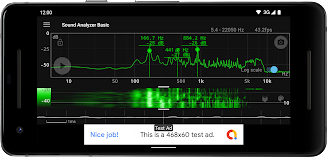
This mobile application, Sound Analyzer Basic, offers real-time analysis of audio signals. It simultaneously displays frequency (Hz) and amplitude (dB) spectrums, along with a time-based spectral change visualization (waterfall view) and sound waveforms. The app boasts high frequency measurement accuracy, typically within 0.1Hz error in low-noise conditions. Key features include peak frequency display, touch-controlled display range adjustment, selectable frequency axis scales (linear and logarithmic), waterfall and waveform views, and a screenshot function.
While the app supports a high frequency range up to 96kHz, frequencies above 22.05kHz might be filtered on many devices, potentially introducing minor noise. Some devices may exhibit increased noise at specific frequencies like 48kHz and 96kHz due to filter processing.
Here are six key benefits of Sound Analyzer Basic:
- Real-time Spectral Analysis: Provides immediate frequency (Hz) and amplitude (dB) spectrum displays for instant audio signal analysis.
- Dynamic Spectral Tracking: Displays spectral changes over time, enabling users to monitor audio signal evolution.
- Waveform Display: Complements spectral analysis with clear sound waveform visualization for a complete audio signal representation.
- Precise Frequency Measurement: Offers highly accurate frequency measurements, generally within 0.1Hz error in quiet environments.
- Flexible Display Range: Allows users to easily adjust the display range via touch controls to focus on specific frequency bands.
- Customizable Frequency Axis: Provides a choice between linear and logarithmic frequency axis scales, offering varied perspectives on spectral data.